
Because in-house fraud investigations can vary in terms of structure, resources, and performance, sometimes we wonder what does an in-house fraud investigation typically look like. Well, thanks to the Association of Certified Fraud Examiners (ACFE), we can answer this question.
Last year the ACFE released a report entitled Benchmarking Your In-House Fraud Investigation Team, which analyzed various engagement metrics from over 800 survey responses. I think you’ll find the results quite interesting.
To frame today’s post, I’ll cover the report’s findings for each of the following critical components of a fraud investigation:
- Oversight of fraud investigations
- Outsourced vs. in-house investigation team
- Time to resolution
- Disciplinary actions against or prosecution of perpetrators, and
- Recovery of fraud losses
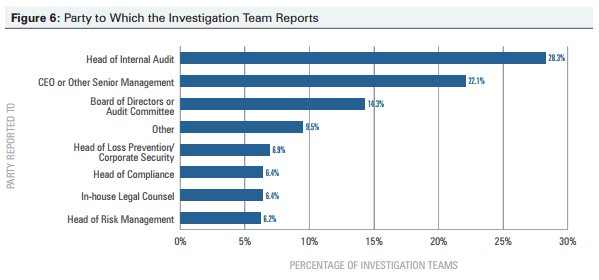
Oversight of fraud investigations
As for structure, approximately half of survey respondents indicated that the investigation team reports either to internal audit leadership (28.3%) or senior management (22.1%). Interestingly, only 6.4% reported to in-house legal counsel. The below chart demonstrates that there is diversity in oversight of fraud investigations, perhaps dependent on the nature of the fraud (financial statement fraud, compliance fraud, asset misappropriation, etc).
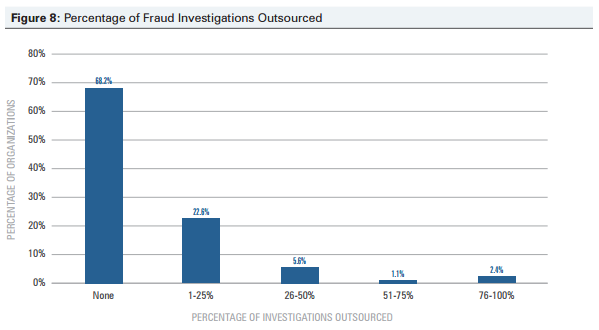
Outsourced vs. in-house investigation team
When it comes to in-house fraud investigations, overwhelmingly the survey respondents (68.2%) indicated they are always performed in-house as opposed to being outsourced. Furthermore, approximately 23% of organizations outsource their investigations up to 25% of the time. One reason for organizations infrequently outsourcing fraud investigations could be due to the fact that over 73% of survey respondents indicated their organizations had over 1,000 employees. Perhaps larger organizations (those with over 1,000 employees) generally have sufficient personnel capacity to perform the investigations.
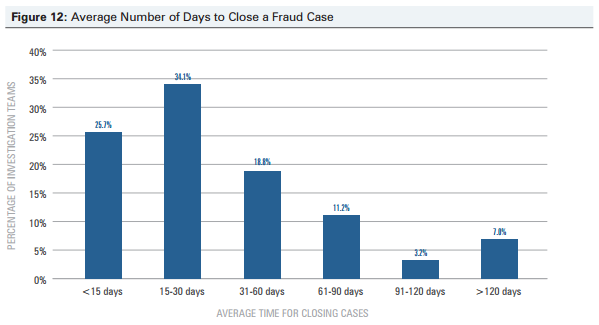
Time to resolution
As practitioners understand, resolving investigations in a timely fashion is paramount to (1) effective detective internal controls and (2) setting an appropriate tone within an organization. According to the report, nearly six in 10 fraud investigations (59.8%) were closed within 30 days. Conversely, just over 10% of fraud investigations took more than one quarter to close. Of course, the duration and extent of a fraud investigation is heavily based on the degree of complexity of the alleged fraud.
Disciplinary actions against or prosecution of perpetrators
Although organizations prefer to prevent fraud from occurring, the reality is that fraud is impossible to completely eliminate from all organizations. Therefore, when it comes to effective internal controls, management should strive to set a “zero tolerance” policy for fraud. In essence, how management reacts to known or suspected fraud, therefore, is critical to setting an appropriate tone within the organization.
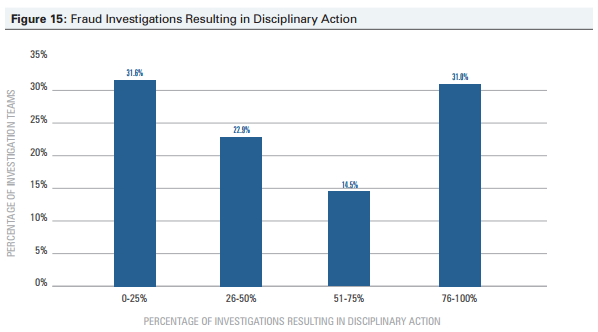
The following chart shows the percentage of investigations that resulted in disciplinary action. Less than a third (31%) resulted in disciplinary action between 76% and 100% of the time. On the other hand, approximately the same amount of investigations (31.6%) resulted in disciplinary action between 0% and 25% of the time.
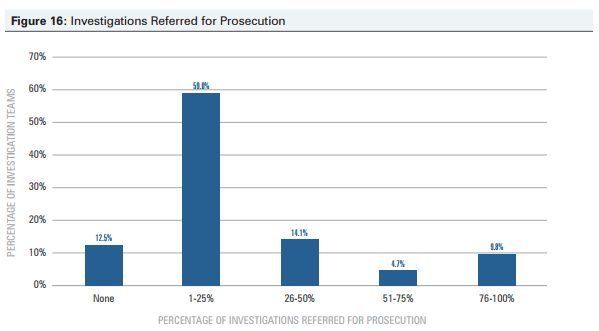
The next chart shows an interesting trend in prosecution referrals. The majority of investigation teams (59%) decided to refer their case for prosecution between 1% and 25% of the time. Conversely, 9.8% of investigation teams referred their case for prosecution between 76% and 100% of the time. As one may expect, there are a number of factors involved with the decision to prosecute. These may include sufficiency of evidence to prosecute, reputational risk, and cost vs. benefit analysis. Hence, the decision to prosecute must be weighed carefully by an organization.
Recovery of fraud losses
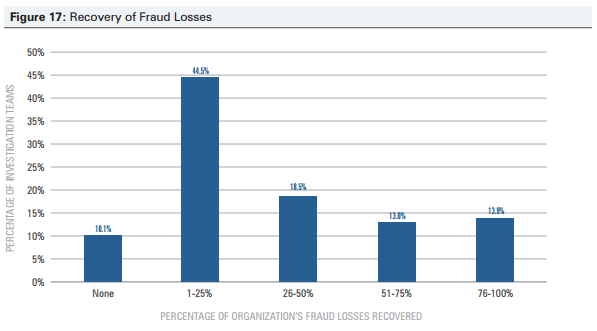
In the end, just because investigation teams substantiate allegations of fraud does not mean the losses are automatically recovered. In light of this, I believe the following chart is one of the most relevant statistics in this report. According to the survey results, the majority of investigation teams surveyed (54.6%) indicated that less than a quarter of the fraud losses were recovered. In contrast, 13.0% and 13.9% of investigation teams indicated that 51% to 75% and 76% to 100% of fraud losses were recovered, respectively.
Final observations
These results are interesting, to say the least. With a focus on continuous improvement, fraud investigation teams should think about how these findings could affect their existing structure, resources, and performance.
In the end, fraud investigation teams will vary in their look and feel, depending on the nature and complexity of the fraud being investigated. Having adequate staffing of in-house investigations with the right level of experience and bandwidth will put teams in the best position to be efficient as well as thorough in their efforts.